History indicates that a spike in defaults is coming.
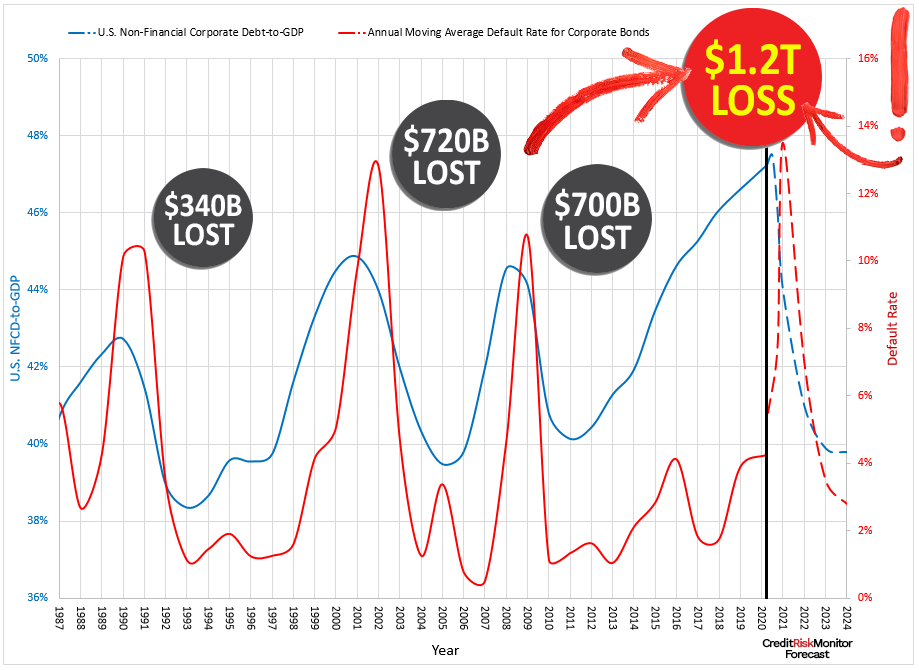
The visual evidence shows that every peak in the ratio of debt-to-GDP is followed by a peak in defaults.
If this cycle repeats itself, the average default rate for U.S. public companies could soar past 12 percent, with estimated losses in excess of $1.2 trillion:
Image

What the lines mean:
U.S. Non-Financial Corporate Debt-to-GDP (Quarterly)
- The single largest driver of corporate risk is the amount of debt on the balance sheet. The blue line paints a picture of historical debt as a percentage of GDP
- Since GDP has grown each and every cycle, the actual dollar level of debt today compared to 1991, 2002 and 2008 is much higher
- The current value of U.S. Non-Financial Corporate Debt is approximately $9 trillion. This debt is held solely from public companies.
Annual Moving Average Default Rate for Corporate Bonds
- This risk is squarely located within U.S. public companies, which represent a large portion of economic activity
- In past credit default cycles, the average annual default rate for corporate bonds has maxed out at ~15%
It's time to face some uncomfortable truths:
- With $9 trillion in public company debt and a 12% default rate, the estimated gross losses from this correction are likely in excess of $1.1 trillion for U.S. public company bondholders. The losses will be even more dramatic for suppliers and purchasers dealing with these defaulting public companies.
- While bond or loan creditors have experienced typical recovery rates in the 40% ($0.40 cents on the Dollar) range, trade creditors have been lucky to receive 10% ($0.10 cents on the Dollar) recovery on their Account Receivables.
- CreditRiskMonitor provides risk assessments for all of these public companies with 96% accurate bankruptcy predictions through the FRISK® score. There is no cheaper insurance policy available in the market!
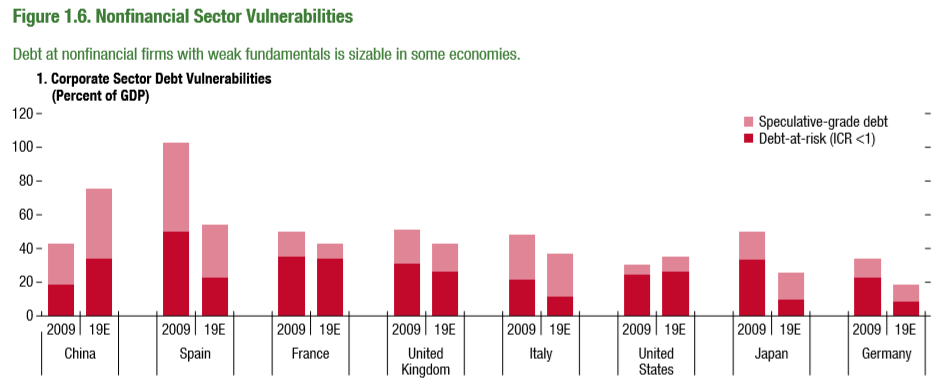
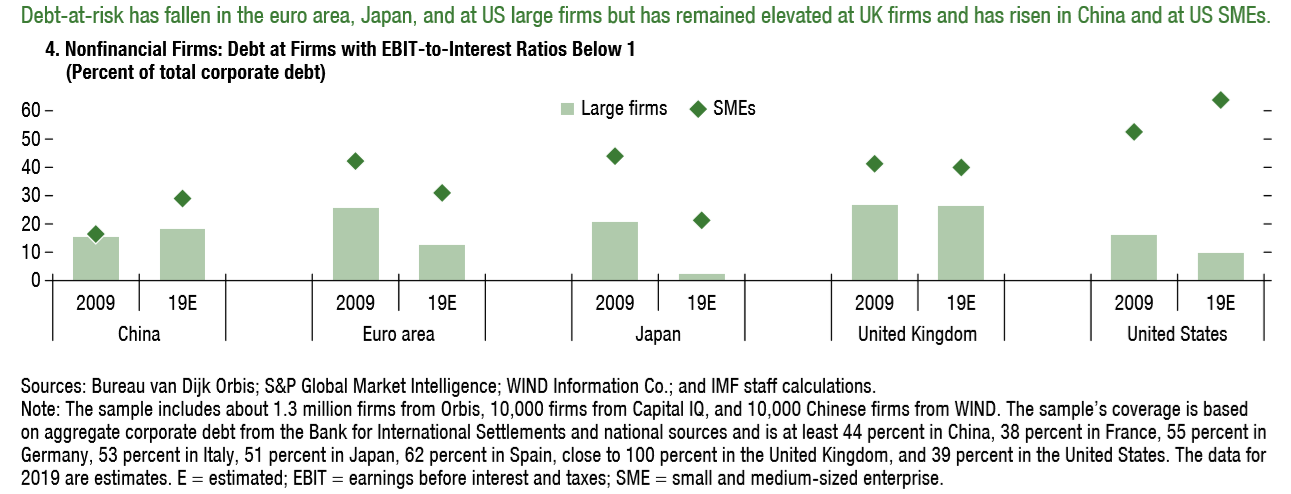
This is a festering worldwide crisis.
Image

Image
